


New release of Highcharts extension supports Highcharts 3.0
A new version of Highcharts extension (ver 2.4.0) for Sencha ExtJs 4 and Touch 2 is released which supports the latest release of Highcharts 3.0 and fixes the compatibility issues with ExtJs 4.2 and Touch 2.1.1.
Here are the details of the latest changes:
- Added support for Highcharts 3.0
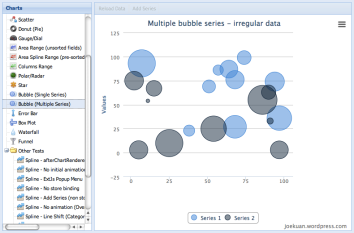
- Bubble series
- Error bar series
- Box Plot series
- Funnel Series
- Fixed initial loading on irregular data series
- Moved sencha property into static field
- Added compatability fix for Sencha Touch 2.1.1
- Added fixes and enhancements submitted by straccio
- Added compatability fixes for Sencha 4.2
- Point click event compatibility issue with Highcharts 3.0
- Refactor buildInitData method
10 Comments
Post a comment


Hello,
i am using your extension with Highcharts 3.0.1 and extJS 4.2.1 in an mvc:
I have build an example and i am forced to define the type in the series:
…series : [{
type : ‘column’,
dataIndex : ‘value’,
name : ‘Betriebssystem’
}] ….
AND the series type in the chart config like this:
….chartConfig :
{
chart :
{
type : ‘bar’
}…..
without the type in the chart config an error occured:
Uncaught TypeError: Cannot read property ‘animation’ of undefined (Highcharts.js:575)
What is the correct way of defining the series type? In the series or in the chart? And how to define 2 or more series in a chart?
Thanks in Advance.
Michi
Sorry for the late reply.
Can you give me the complete example code which generates that error?
As for declaring global series type
chartConfig: {
defaultSerieType: ‘bar’,
….
}
for a simple chart with 2 or more series in a chart. Please refer the standalone.js example.
You can view it via http://joekuan.org/demos/Highcharts_Sencha/desktop/standalone.html
Joe
Hello,
thanks for your reply. I am using this code:
this.items = [
{
xtype : ‘highchart’,
itemId : ‘chartObj’,
store : store,
id : ‘chart’,
series : [
{
// type : ‘column’,
dataIndex : ‘value’,
name : ‘Betriebssystem’
}],
xField : ‘name’,
chartConfig :
{
chart :
{
defaultSerieType: ‘column’
},
title :
{
text : ‘Operating System (Users)’
},
yAxis :
{
min : 0,
title :
{
text : ‘Users (millions)’,
align : ‘high’
}
},
tooltip :
{
formatter : function() {
console.log(this)
return ‘BS: ‘ + this.x + ‘ – ‘ + this.y + ‘ User’;
}
},
plotOptions :
{
series :
{
colorByPoint : true
},
bar :
{
dataLabels :
{
enabled : true
}
}
}
}
}
];
and then this error occured:
Uncaught TypeError: Object [object Object] has no method ‘draw’
I have to config the series type in the series config AND chart config – to get this work.
Thanks in Advance.
My fault … ignore the posted error.
My problem is:
The chart is not shown, when the series type is not configured in the series config AND chart config. The chart is then shown without data columns.
Currently, the defaultSerieType option is taken from a higher level.
this.items = [
{
xtype : ‘highchart’,
itemId : ‘chartObj’,
store : store,
defaultSerieType: ‘column’,
id : ‘chart’,
series : [
{
// type : ‘column’,
dataIndex : ‘value’,
name : ‘Betriebssystem’
}],
xField : ‘name’,
….
However, this will be fixed in the next release that the defaultSerieType and default ‘type’ are taken from the highchart’s chart level.
Thanks
Joe
Hello Joe,
thanks for your reply – that is now clear.
Now i have a further problem after changing to your new release – events are no longer fired:
This is the code and the event is not fired:
point :
{
events :
{
click : function(point) {
console.log(‘checkEvent’);
}
}
}
Any Idea?
Thanks!
Michi
Hi,
I’m using a bubble chart, but I wanna say if it’s possible to change of name on the legend, because now they names are Series 1, Series 2, etc.., but I want change with the user of my blog. I just create a function to get the valors of my db mysql.
Thanks a lot for you help.
I don’t think you can change the name on the legend dynamically for any series type.
For now, you can do
series : [{
type : ‘bubble’,
dataIndex : ‘series1’,
name: ‘Bob’
}, {
type : ‘bubble’,
dataIndex : ‘series2’,
name: ‘Adam’
}],
Alternatively, you can try addSeries and removeSerie method to add/remove series dynamically to the chart. For example, in your store load method to construct the series object from the record and call addSeries.
Hope this help
Joe
Hello Joe,
In our project we use ExtJS 4, and we are not 100% happy with the charts which come with ExtJS, so Highcharts would be a good solution for us, and now I’m evaluating this possibility.
Unfortunately we need to support IE8 (I know, I know, it’s as old as mammoth’s… tail, but our clients still use it), and we used to have serious problems with memory consumption in IE8, so as a part of my evaluation I checked this combination (ExtJS + Highcharts) for memory leaks.
I used ‘sIEve’ (from here: http://home.wanadoo.nl/jsrosman/), opened http://joekuan.org/demos/Highcharts_Sencha/desktop/ in sIEve, selected ‘Spline’, then clicked ‘about:blank’ in sIEve and enjoyed ‘0’ value in ‘#leaks’ column. So far, so good.
In the second test after selecting ‘Spline’ I selected ‘Column’ without reloading the page (a typical AJAX scenario IMO), then clicked ‘about:blank’ in sIEve and saw 323 (objects) in ‘#leaks’ column. Not so good.
In the third test I opened http://www.highcharts.com/demo/ page in sIEve, selected several different charts (without reloading the whole page), clicked ‘about:blank’ again and it was ‘0’ again in ‘#leaks’ column in sIEve.
So Highcharts don’t create memory leaks, but ExtJS + Highcharts does. And not in all cases, only when you load several charts without reloading the page.
I tried to look at the source code of you extension, but I didn’t see any obvious reason for memory leak in IE8, like closure or circular reference. Sorry for the boring question, but do you have any idea why memory is leaking in this case?
Thanks a lot!
Hoopoe.
Hi,
There are probably memory leaks in the Highcharts extension but you are the first one to report it. However, I think the majority of the memory leaks are in my demo code. Honestly, the demo is written in a rush and there are rough edges.
Inside the module, there is standalone.html which uses the extension in the simplest form. So you can check. Meanwhile, I will try to have a look if I can find some time.
Joe